Line Scan Microscopy
—delocalized, efficient microscopic imaging
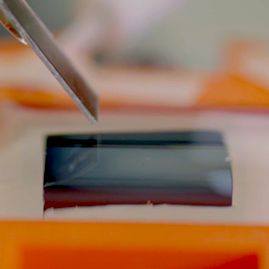 Closeup side view of a lab-made line probe near sample with glued specimen.
We study the use of line probe in microscopy for structured signal. Unlike the conventional use of point probe, by which the scanning probe microscopy takes pointwise samples; each of the line probe measurement is accumulated electric current generated between the contact surface of line shaped probe and sample. The line probe measurements are delocalized and hence more efficient, reducing the scanning time for structured signal by orders of magnitude.
Here, we will study it in the context of a particular microscopy modality known as scanning electrochemical microscopy (SECM).
Imaging Modality
Chemical Probe
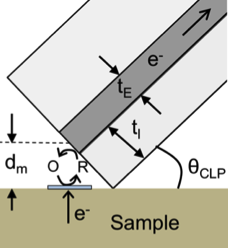 Redox reaction between probe and sample.
The SECM line probe measures the redox reaction between the probe and the electroactive parts of the sample. The line probe consists of a thin conductive layer (dark gray) sandwiched by two insulating layers (light gray). The sensitive area between probe and sample is a thin line of width $t_E$. The distance $d_m$ between the probe and sample is stable by keeping contacting angle $\theta_{\text{CLP}}$ the same though out the scanning procedure.
In a single measurement, a negative potential is applied to the probe end, induces redox reaction near the sensitive part of sample. This produces an influx of negative charge current.
Line Scan
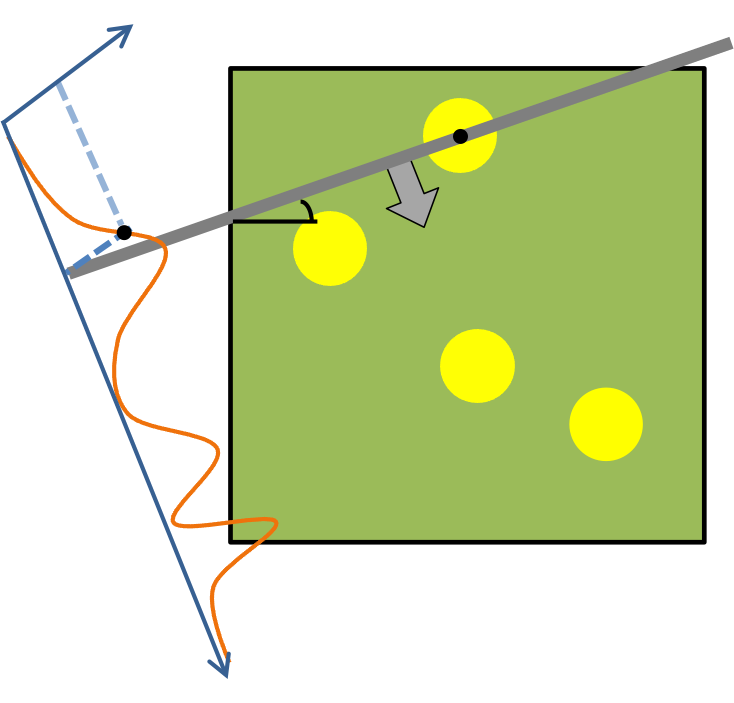 Redox reaction between probe and sample.
The line probe (gray) “sweeps” through the sample (green and yellow) in a predefined direction (arrow). The contact surface between probe and sample constitutes a straight line, from which the line probe measures the integrated electric current as a single measurement.
The line probe takes equispaced steps in its proceeding direction, generates a line scan (orange), as the function from steps distance to electric currents.
Schematic
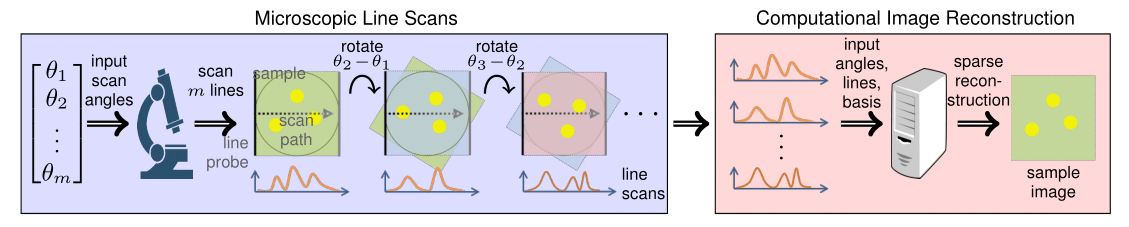
The full microscopic scanning procedure is comprised of multiple line scans. After a line scan sweep finishes, the sample is rotated by an assigned angle, then another line scan proceeds; this scanning procedure repeats until required amount of line scan measurements at different angles are obtained.
The final microscopic image is reconstructed via these line scan measurements.
Related works
The microscopic line scans as an imaging methodology is closely related to tomography [1].
Experiment Demo
We begin this study on a dataset with strong structure, in which the samples consist some number of small particles. This is an image modality appears in applications related to microscopy [2], [3]. We assume the image of particles $\mathbf Y = \mathbf D*\mathbf X$ is the convolution of a known particle function $\mathbf D\in L[\mathbb R^2]$ with location with map $\mathbf X$. The $m$-line scans of image $\mathbf Y$ generates lines $\mathbf R$ as
\[ \mathbf R = \mathcal S[\mathbf \psi * \mathcal L_{\Theta}[\mathbf D*\mathbf X]], \]
where $\mathcal S$ is the sampling operator, $\mathbf \psi$ is the point spread function (PSF) of a line scan, and $\mathcal L_{\Theta}$ is line projections with respect to angles $\Theta$.
Reconstruction Algorithm
Image reconstruction from line scans under this scenario can be cast as finding the unknown location $\mathbf X$, which is a well understood sparse recovery problem. Due to physical limitation, we only have partial information for PSF $\mathbf \psi$, therefore we solve for $\mathbf X$ while simultaneously calibrate $\mathbf \psi(p)$ with parameters $p$
\[ \min_{p,\mathbf X} \lambda\lVert\mathbf X\rVert_1 + \tfrac12 \lVert\mathcal S[\mathbf \psi(p) * \mathcal L_{\Theta}[\mathbf D*\mathbf X]] - \mathbf R\rVert_2^2 \tag{1}\]
The algorithm (1) serves as a good cornerstone for the reconstruction method; it is advised to modify (1) accordingly to accommodate several properties of line scans to achieve satisfactory image reconstruction results.
Demo
We demonstrate an example of scan line image reconstruction from lab made SECM microscope. The top row compares the image from of point probe and line probe over a sample with 3 particles. The bottom row shows the result of line probe over a larger sized sample with 10 particles. Image resolution is $10\mu m$ per pixel.
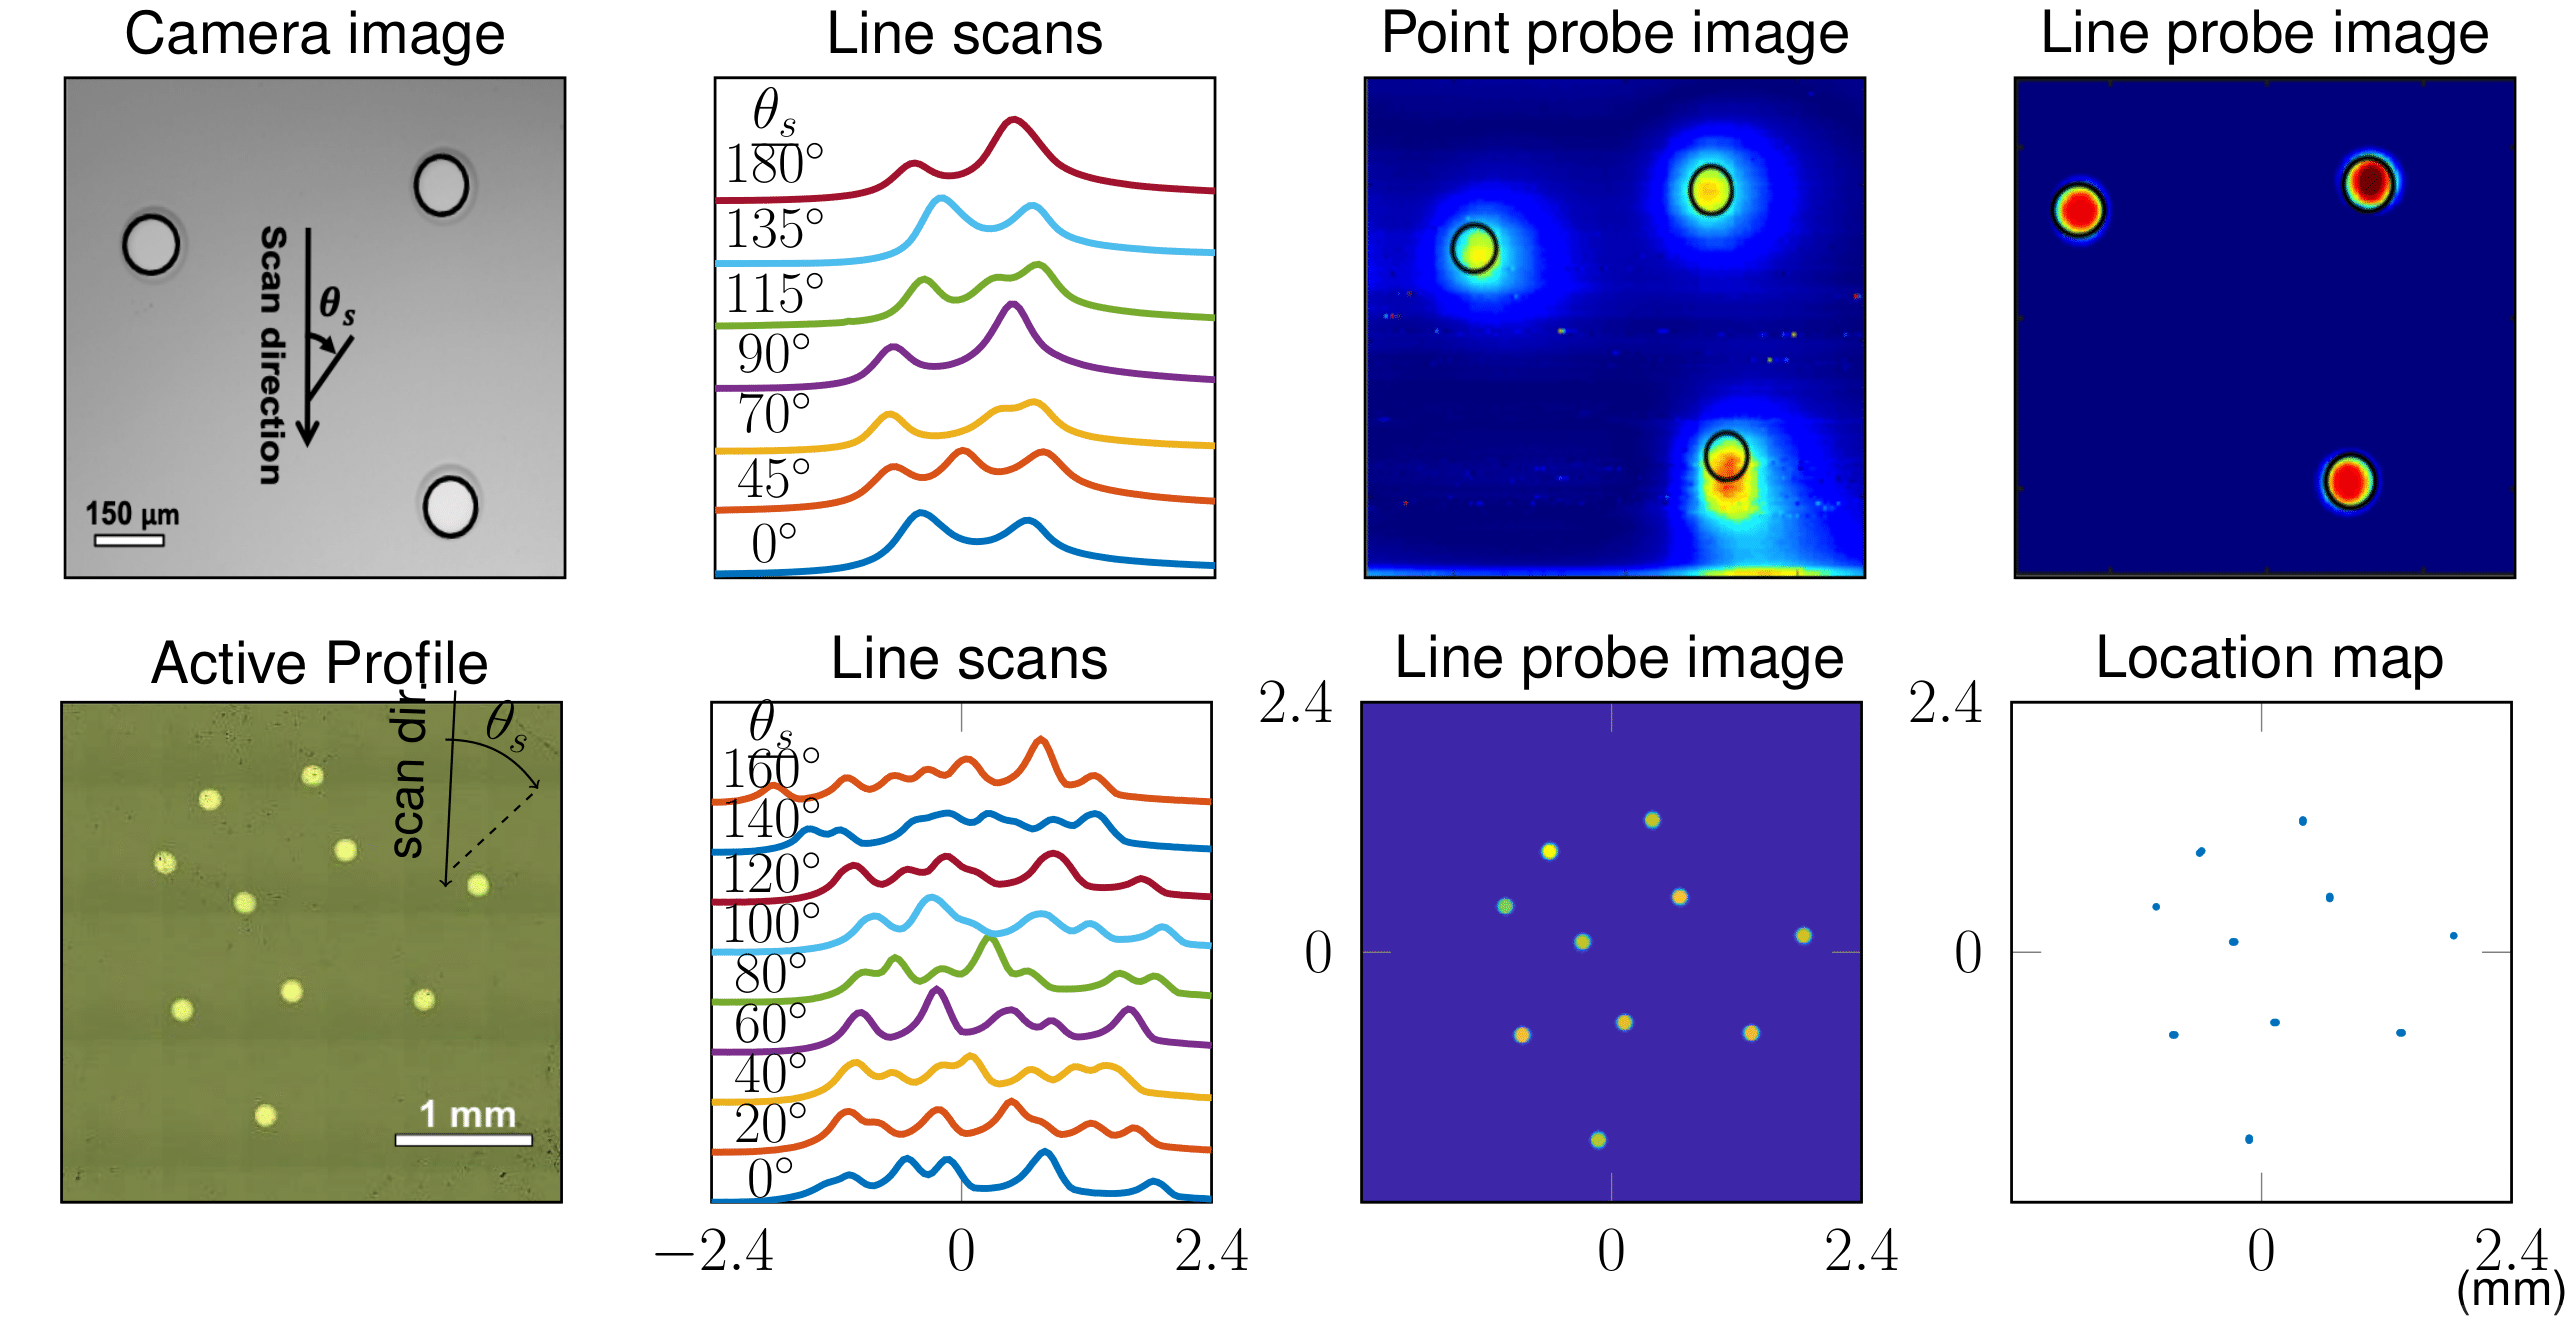 Top row: 3 particle sample. Bottom row: 10 particle sample. Image pixel width/height are $10\mu m $.
Resources
Selected Papers
Compressed Sensing Microscopy with Scanning Line Probes
In review, 2019
Scanning Line Probe Microscopy: Beyond the Point Probe
Analytical chemistry, 2018
Code Package
The package for both simulation and real data reconstruction for microscopic line scans (Matlab) can be downloaded via the following github link:
https://github.com/clpsecm/clpsecm_imaging
References
[1]. G. T. Herman, Fundamentals of computerized tomography: image reconstruction from projections. Springer Science & Business Media, 2009.
[2]. M. E. Davis, J. E. Zuckerman, C. H. J. Choi, D. Seligson, A. Tolcher, C. A. Alabi, Y. Yen, J. D. Heidel, and A. Ribas, Evidence of rnai in humans from systemically administered sirna via targeted nanoparticles, Nature, vol. 464, no. 7291, p. 1067, 2010.
[3]. C. A. S. Batista, R. G. Larson, and N. A. Kotov, “Nonadditivity of nanoparticle interactions”, Science, vol. 350, no. 6257, p. 1242477, 2015.